How to check your account resource limits (503 or 508 errors)
Updated 9 months ago
by
Ben Oates
If you're seeing a 503 error in response to your request to view a web page this indicates the server was not ready to handle the request. A 508 (Loop detected) error also indicates a resource limit issue.
Rarely this could be an issue with the server being unavailable or down for maintenance.
However, much more likely is that you are reaching a limit on your hosting package - either CPU, RAM, Disk Space or I/O.
This guide shows you how to check your cPanel account's memory, CPU and process usage. To ensure fair use of the server's resources by our users, we virtualise individual requests made by your account and monitor these requests to ensure they do not:
Use too much memory
Consume too much CPU time
Initiate (not spawn) too many processes
If your cPanel account (including it's websites) exceeds the limits set by the package you are on, then you may notice that pages may be slow to load, or may even result in an error message.
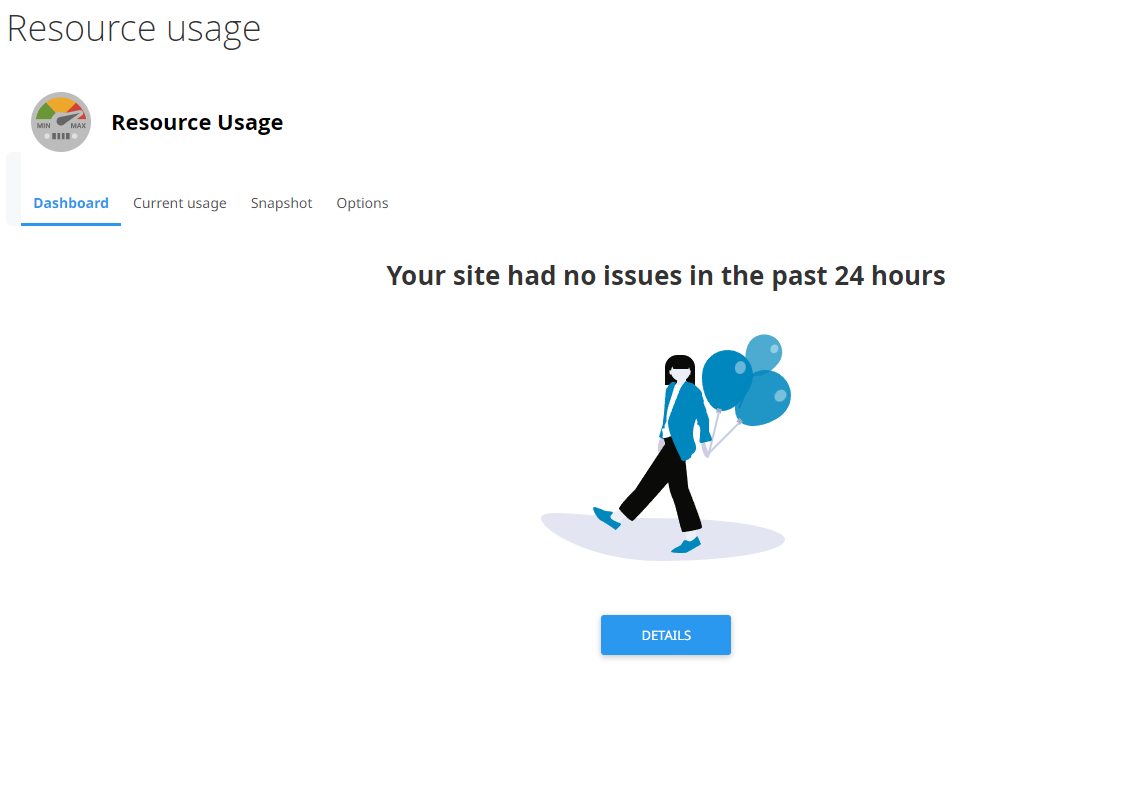
Within cPanel >> Metrics - click Resource UsageWithin the Dashboard, you'll likely see one of two messages if there's an issue:
Your account has not been limited in the past 24 hours - there's no issue with you hitting your limits
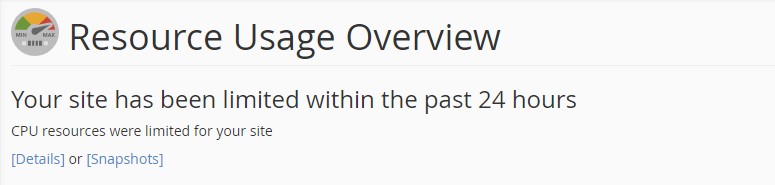
Your account has been limited in the past 24 hours - you'll need to investigate why you are hitting your account limits to understand if this is ok or not.
There's also a possibility you'll see a message that says 'Your site might hit resource limits soon'. You'll normally see details about which limit was near being reached. This message indicates that your account has exceeded 90% of the available CPU, memory or entry processes within the last 24hrs. We'd suggest that you investigate further why your site might be near a limit - it's better to find and fix any issues with your site/code/caching before your site actually gets limited.
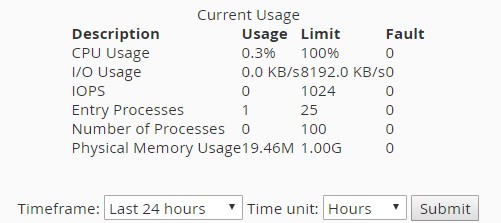
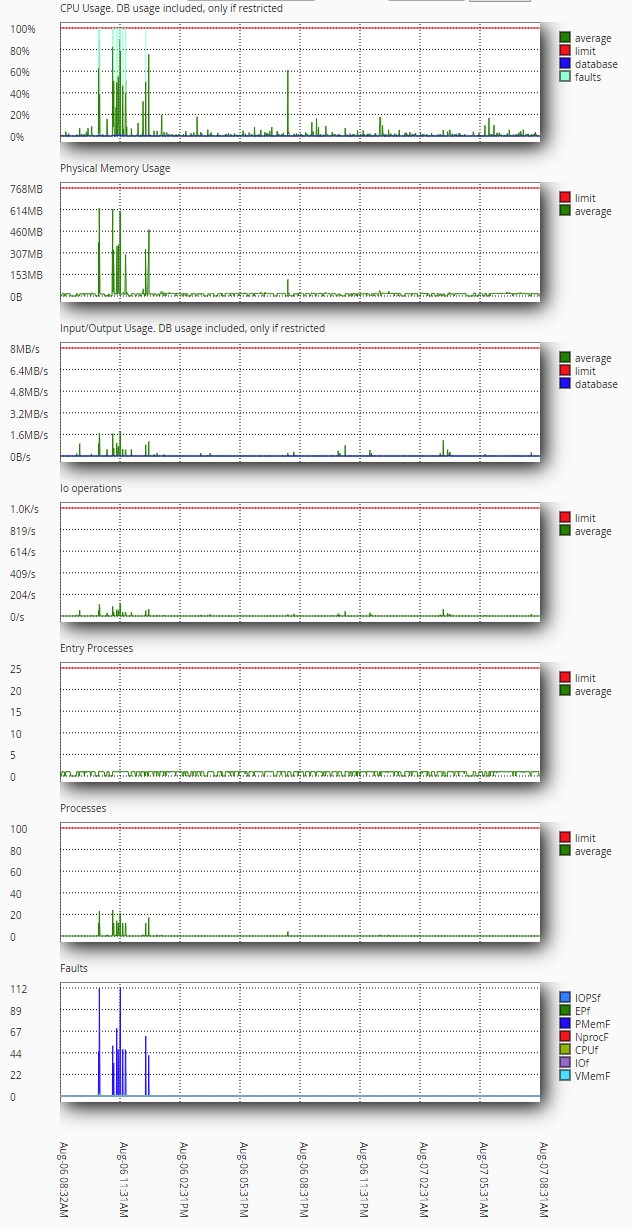
Clicking [Details] will give an overview of what was limited. The default time frame is Last 24 hours - but you can select from the drop-down list.Below this, you'll see a number of graphs that visually represent the resource usage.CPU Usage - You are allowed to use up to the equivalent of an entire CPU core (100%). The most important factor here is the average usage - if you see the average hitting the maximum limit much of the time, then you need to address it. CPU is very prone to peak, and will often be one of the first resources to max out - so seeing the max value hit the limit is not a sign of a problem and is entirely normal - of course you want to throw all the CPU power you can muster at any task your account is running! Physical Memory Usage - This is the amount of RAM your processes and file cache are currently consuming. Memory management in Linux is sophisticated, and high memory usage doesn't necessarily indicate a problem, as objects may be retained in memory to improve performance. Input/Output Usage - This indicates the amount of data your processes have written to and read from the server's storage systems. IO Operations - This indicates the number of individual Input/Output operations your processes have requested. An operation might be opening or closing a file, connecting to the internet, or to a local service on the server. Entry Processes - This is the number of new processes your account creates. In the most simple terms, when you create a new connection to Apache, this is counted as an entry process. If your processes are very slow to run due to complexity, then a busy site may run out of available entry processes. Processes - This indicates the total number of processes that your user account is running. This number includes all Entry Processes so will always be higher than that number. Faults - This graph shows the number of faults being recorded by the system for Input/Output Usage (IOPSf), Entry Processes (EP), Physical Memory (PMemF), Processes (NprocF), CPU Usage (CPUf), IO Operations (IOf). We don't set limits on Virtual Memory (VMemF) so this will never show up on the final graph.
A more detailed view can be found in [Snapshots] where you can choose a date and then snapshot time to view the processes running that caused the limit to be reached.